
Know where your power goes
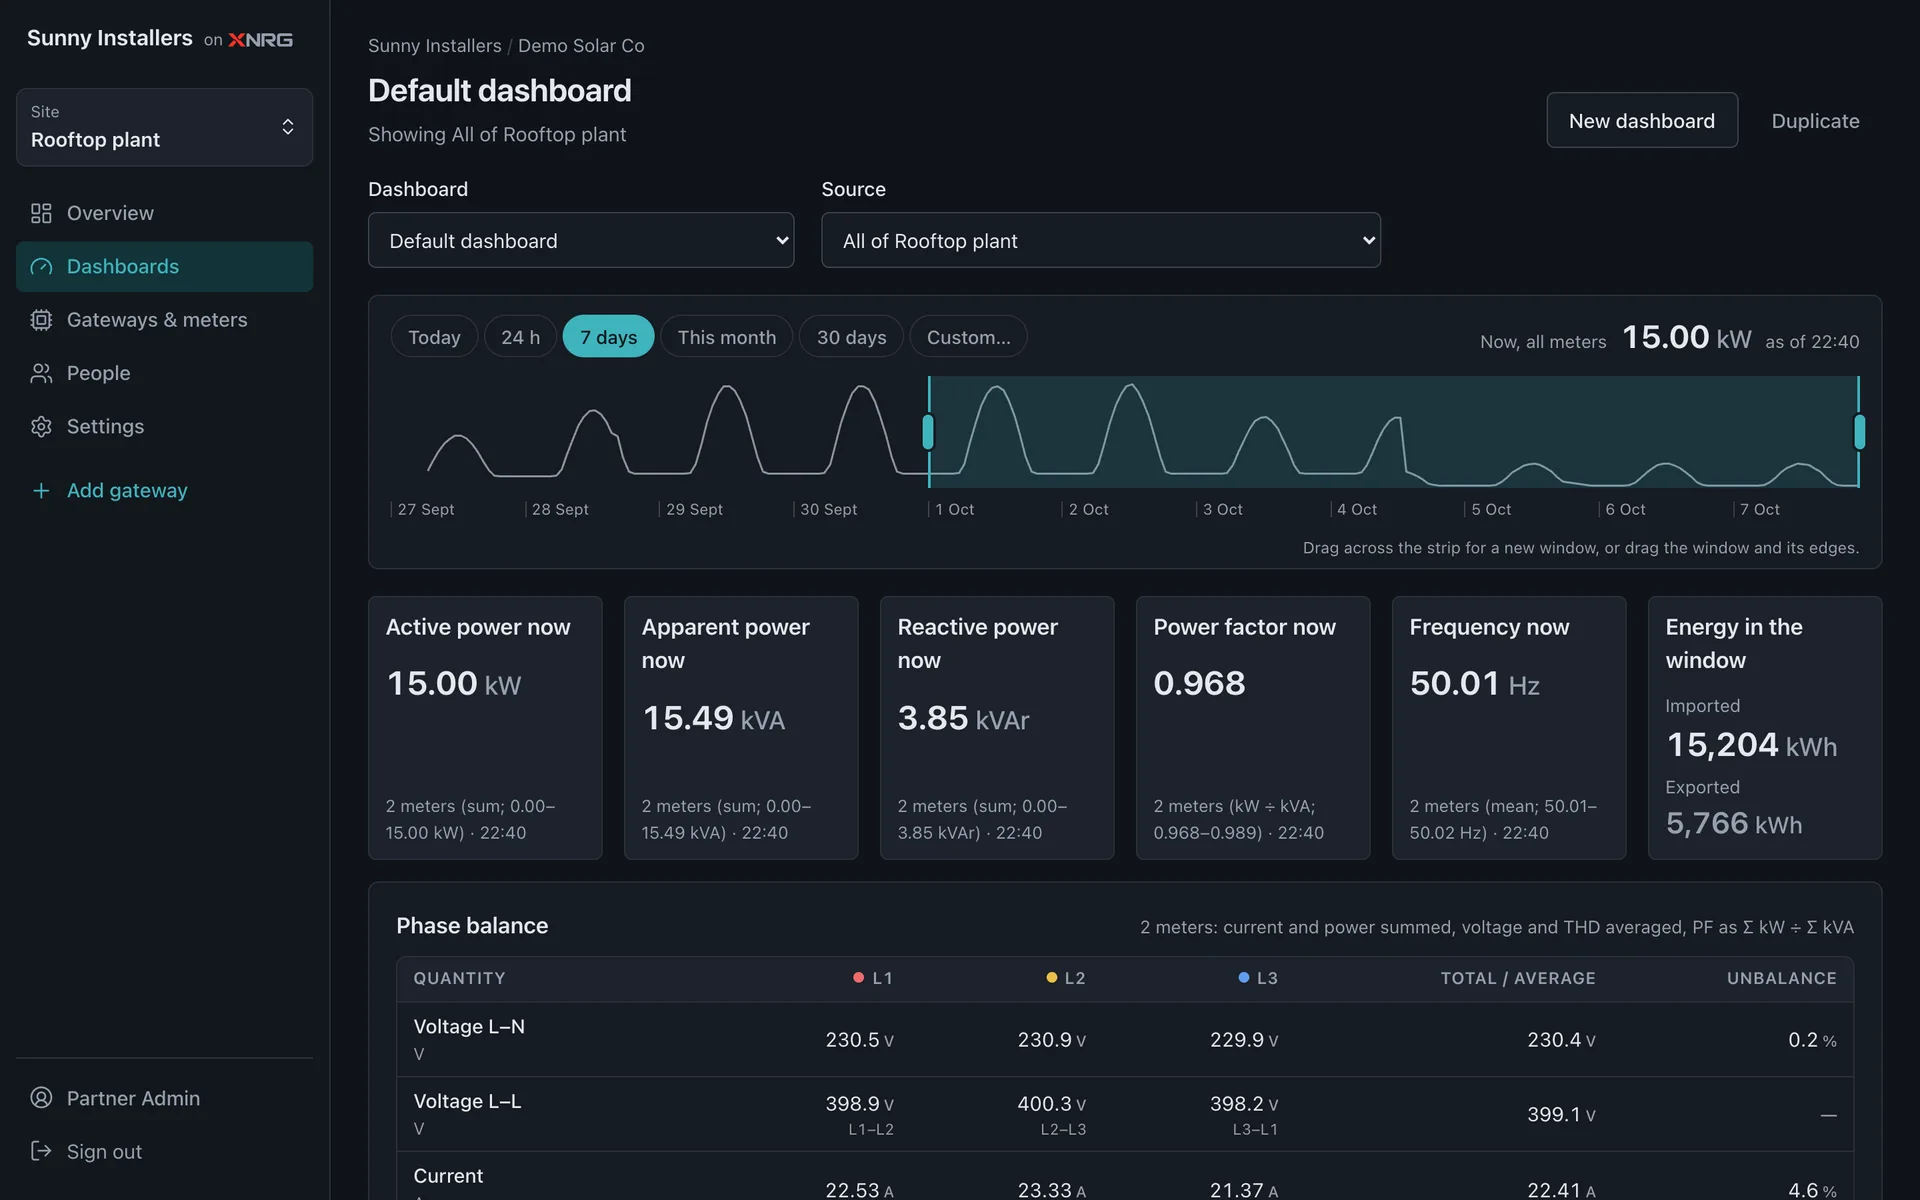
Put every meter on one dashboard. See demand as it happens, energy per day and the quality of your supply, for one building or fifty.
Spot the peaks
See when demand climbs and which site drives it, minute by minute.
Compare sites
Put factories, shops and offices side by side with the same numbers.
Catch supply problems
Watch voltage, power factor and harmonics before they cost you equipment or penalties.
app.xnrg.in
What you can track
- Active, apparent and reactive power
- Energy imported and exported
- Voltage and current per phase
- Power factor and frequency
- Voltage and current harmonics (THD)
- Phase unbalance
- Peak demand per site
- Gateway and meter status
Start with your main incomer
One gateway and one meter is enough to see the shape of your day.